RunScore
All 3,143 U.S. counties ranked
A county-level index of running culture and physical activity infrastructure.
Luke Popler · Sequoia High School · April 2026

A score from 0 to 100 for every U.S. county — measuring running culture: races, activity levels, walkability, and fitness infrastructure.

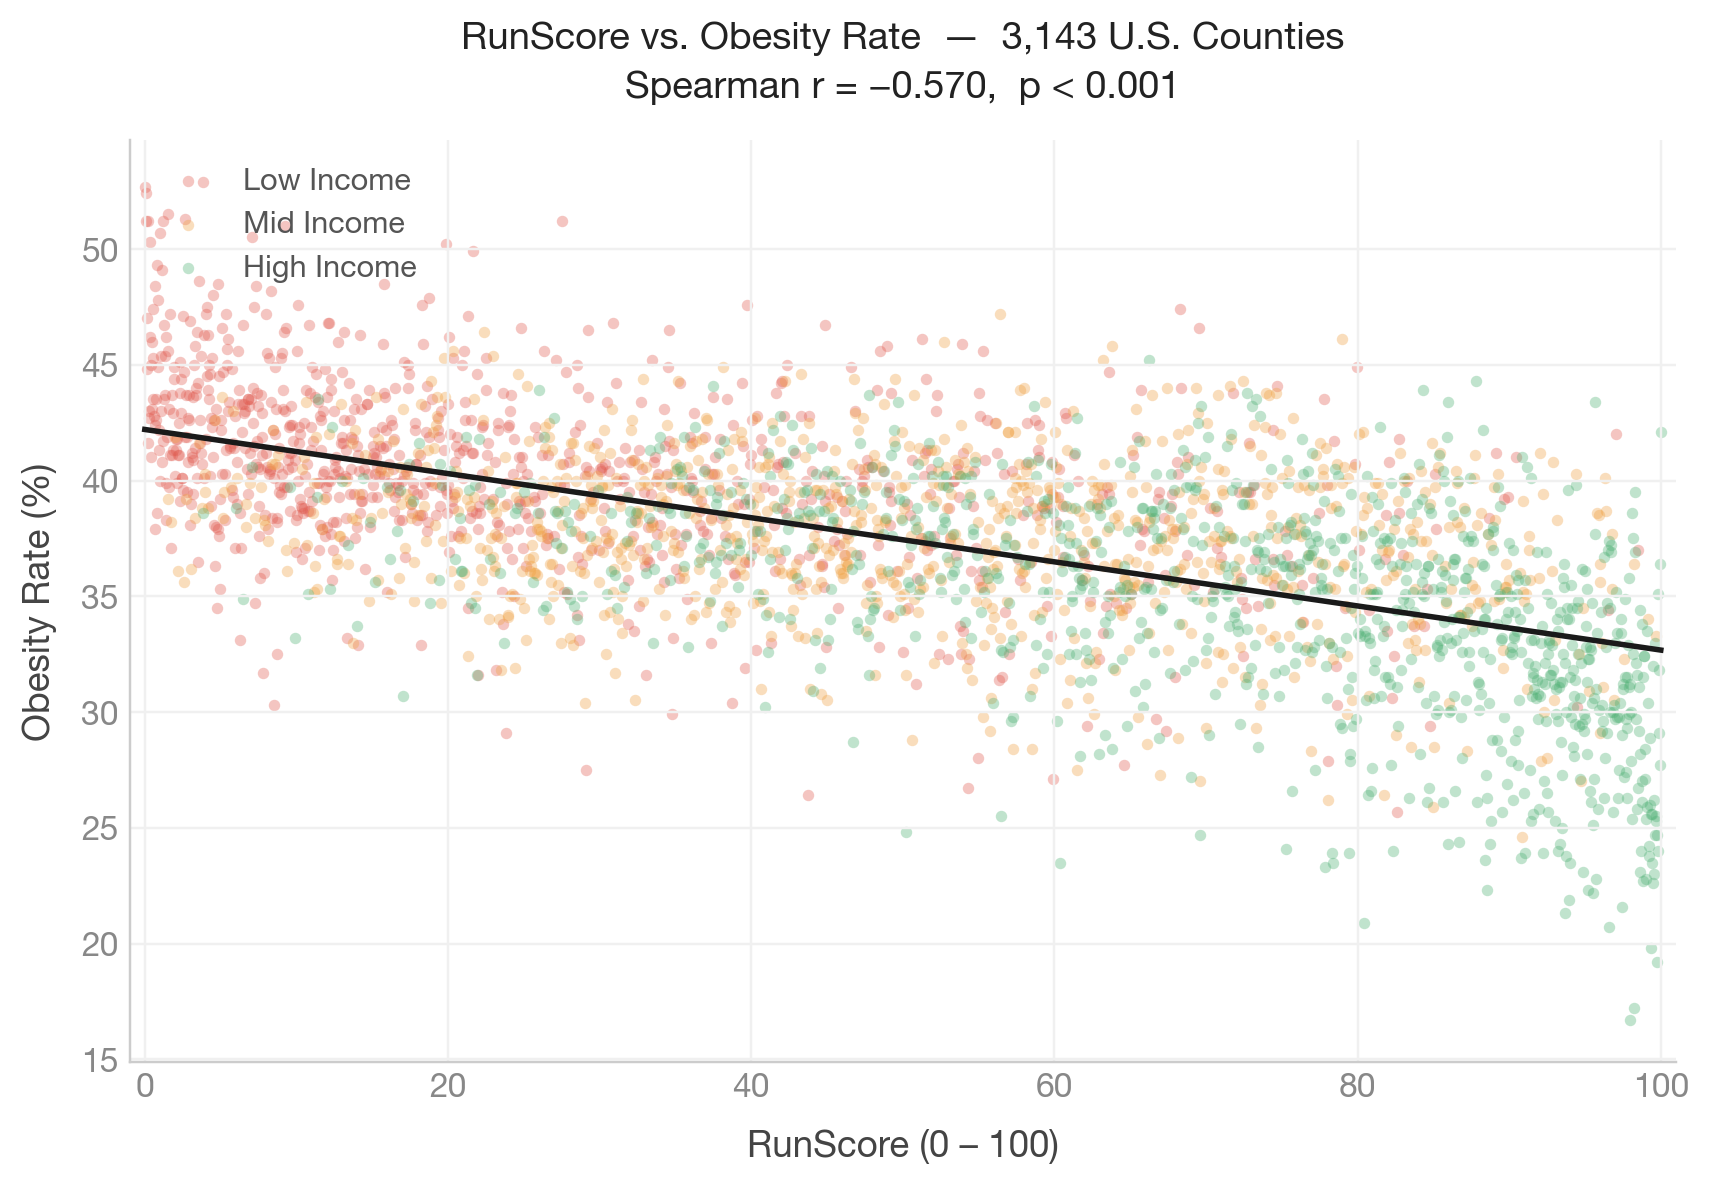
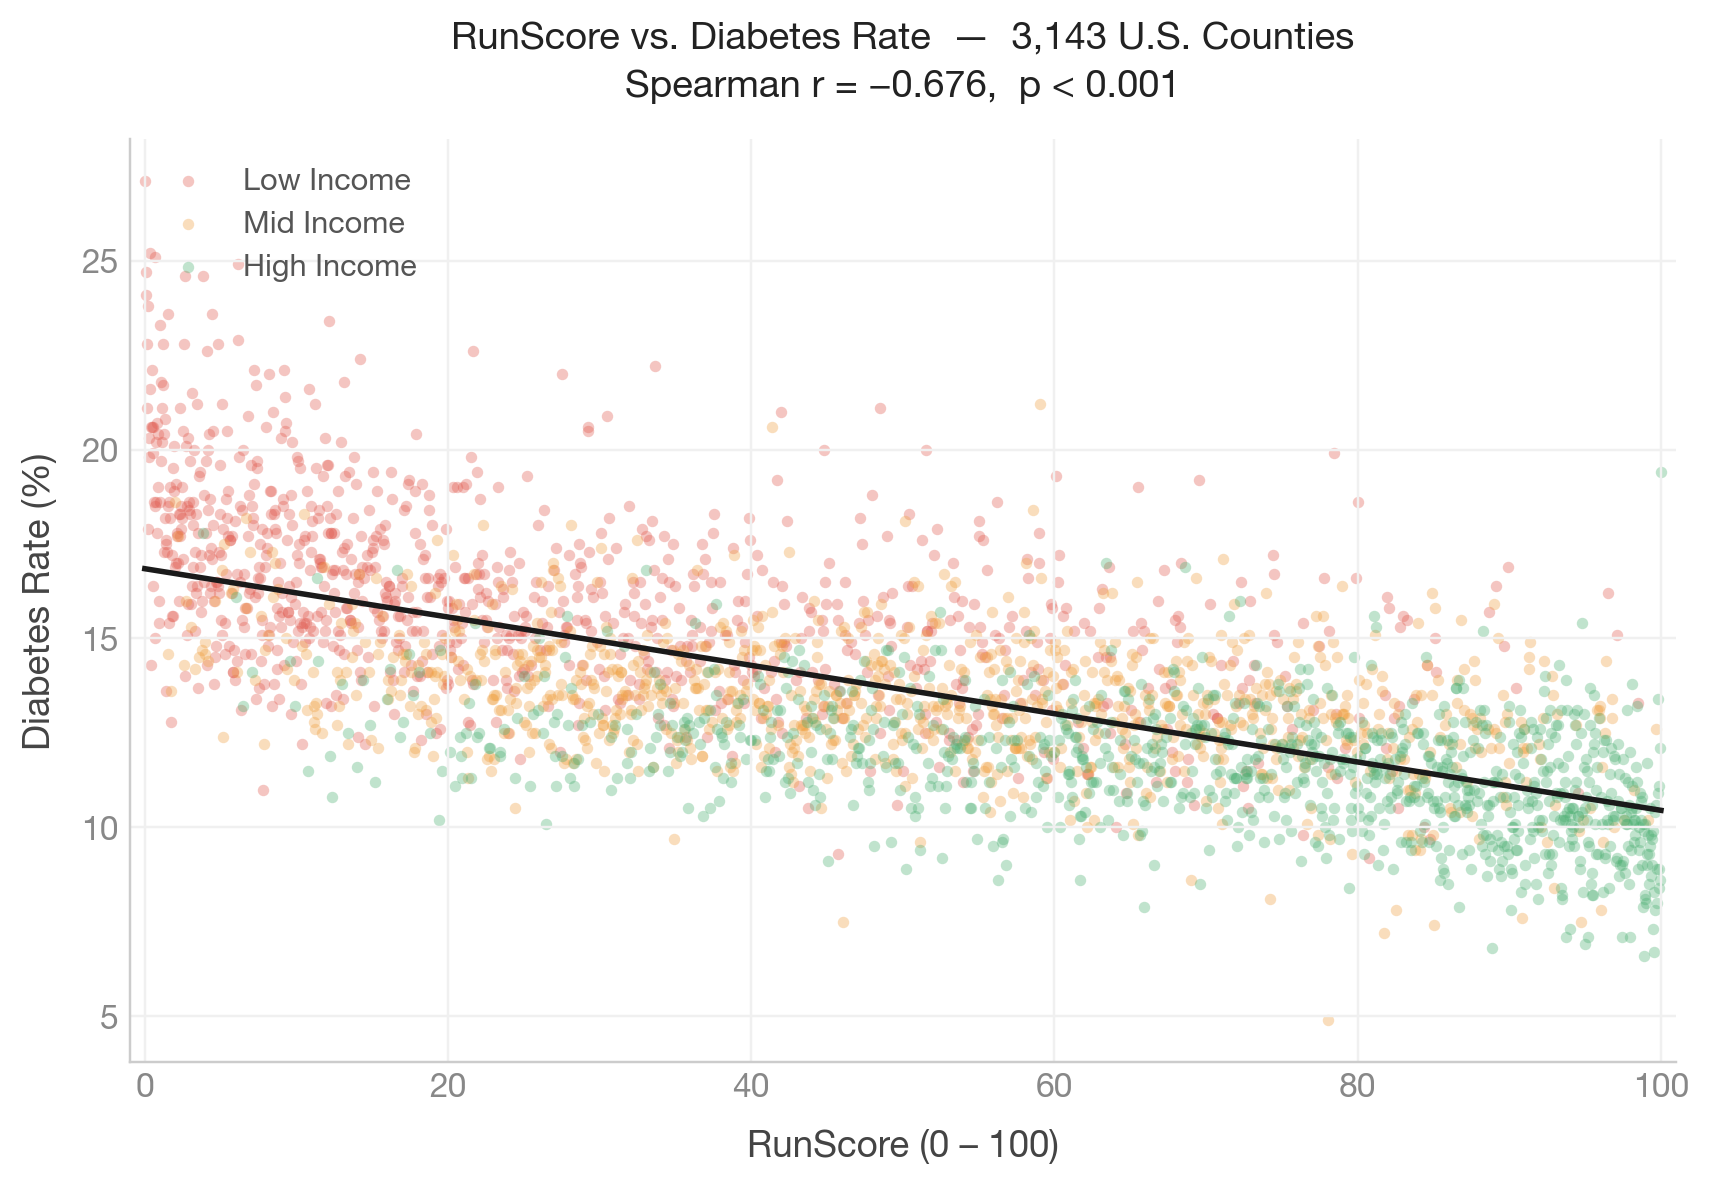
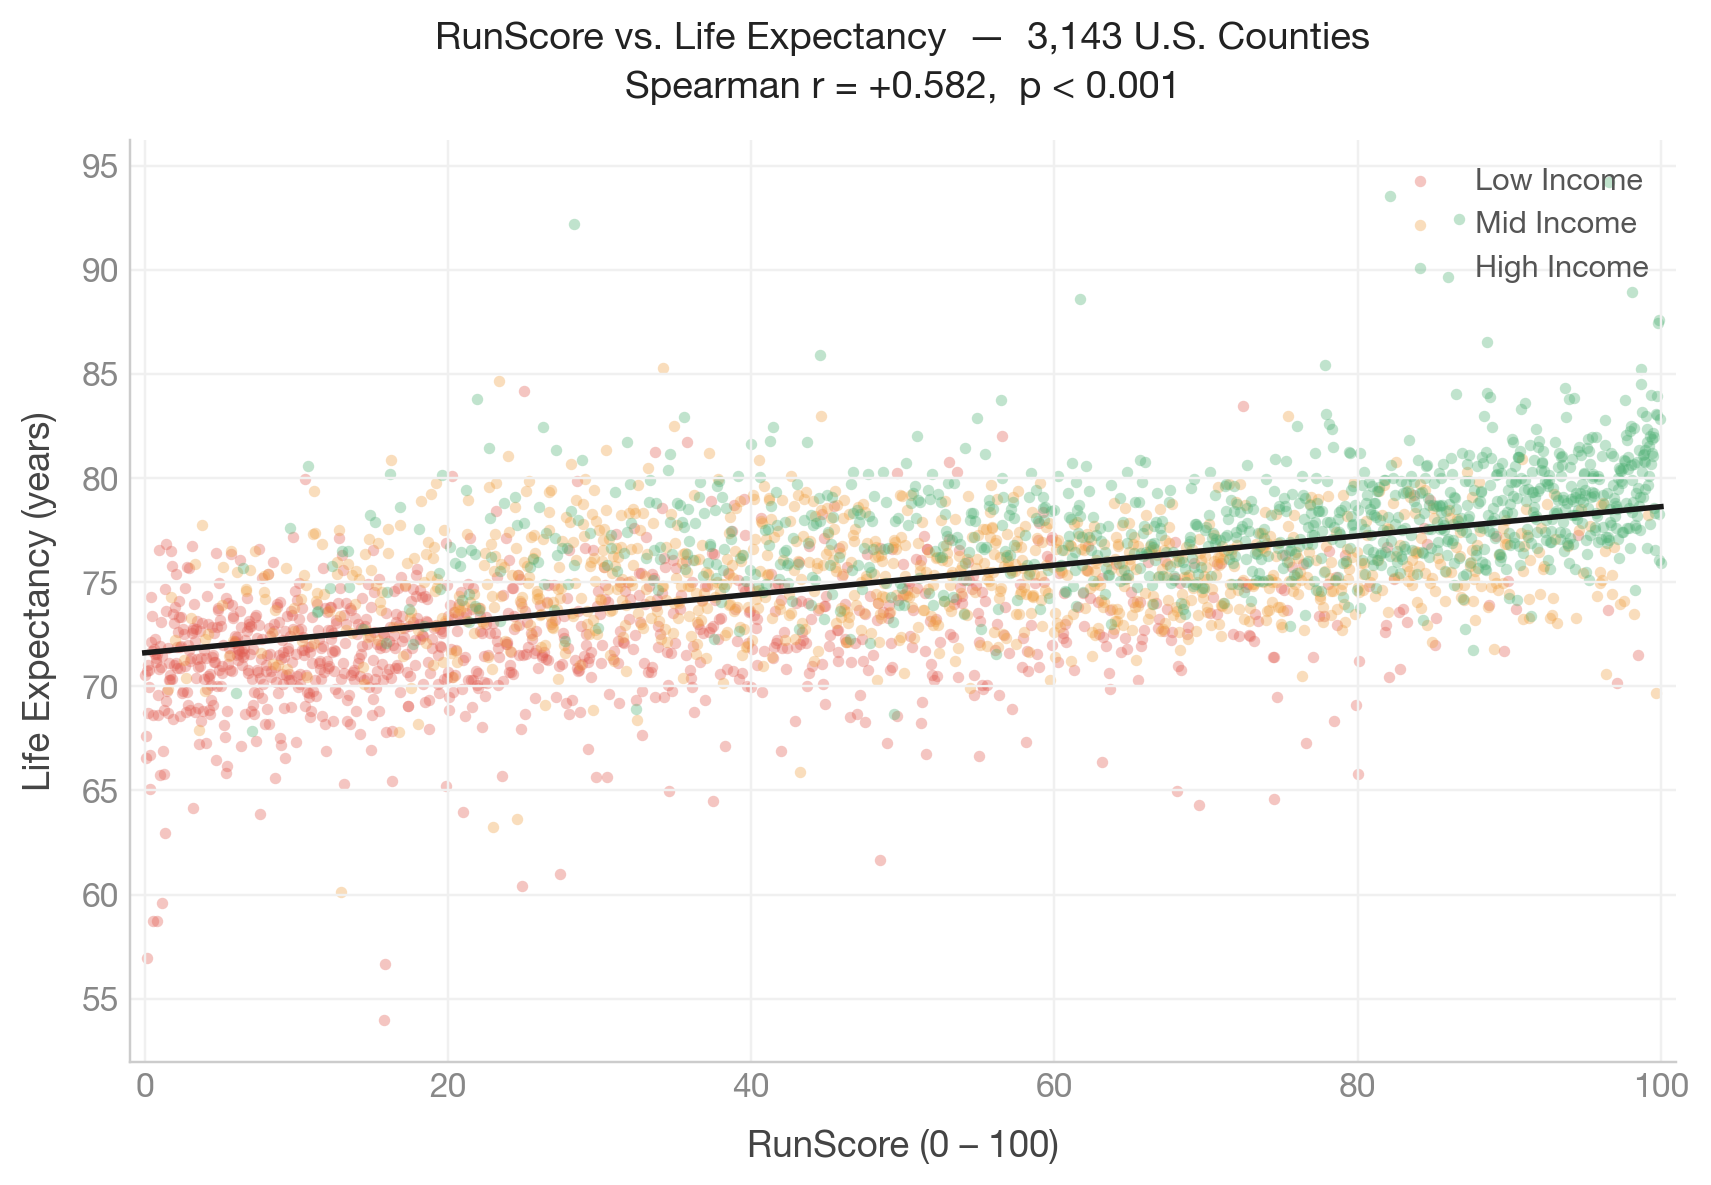
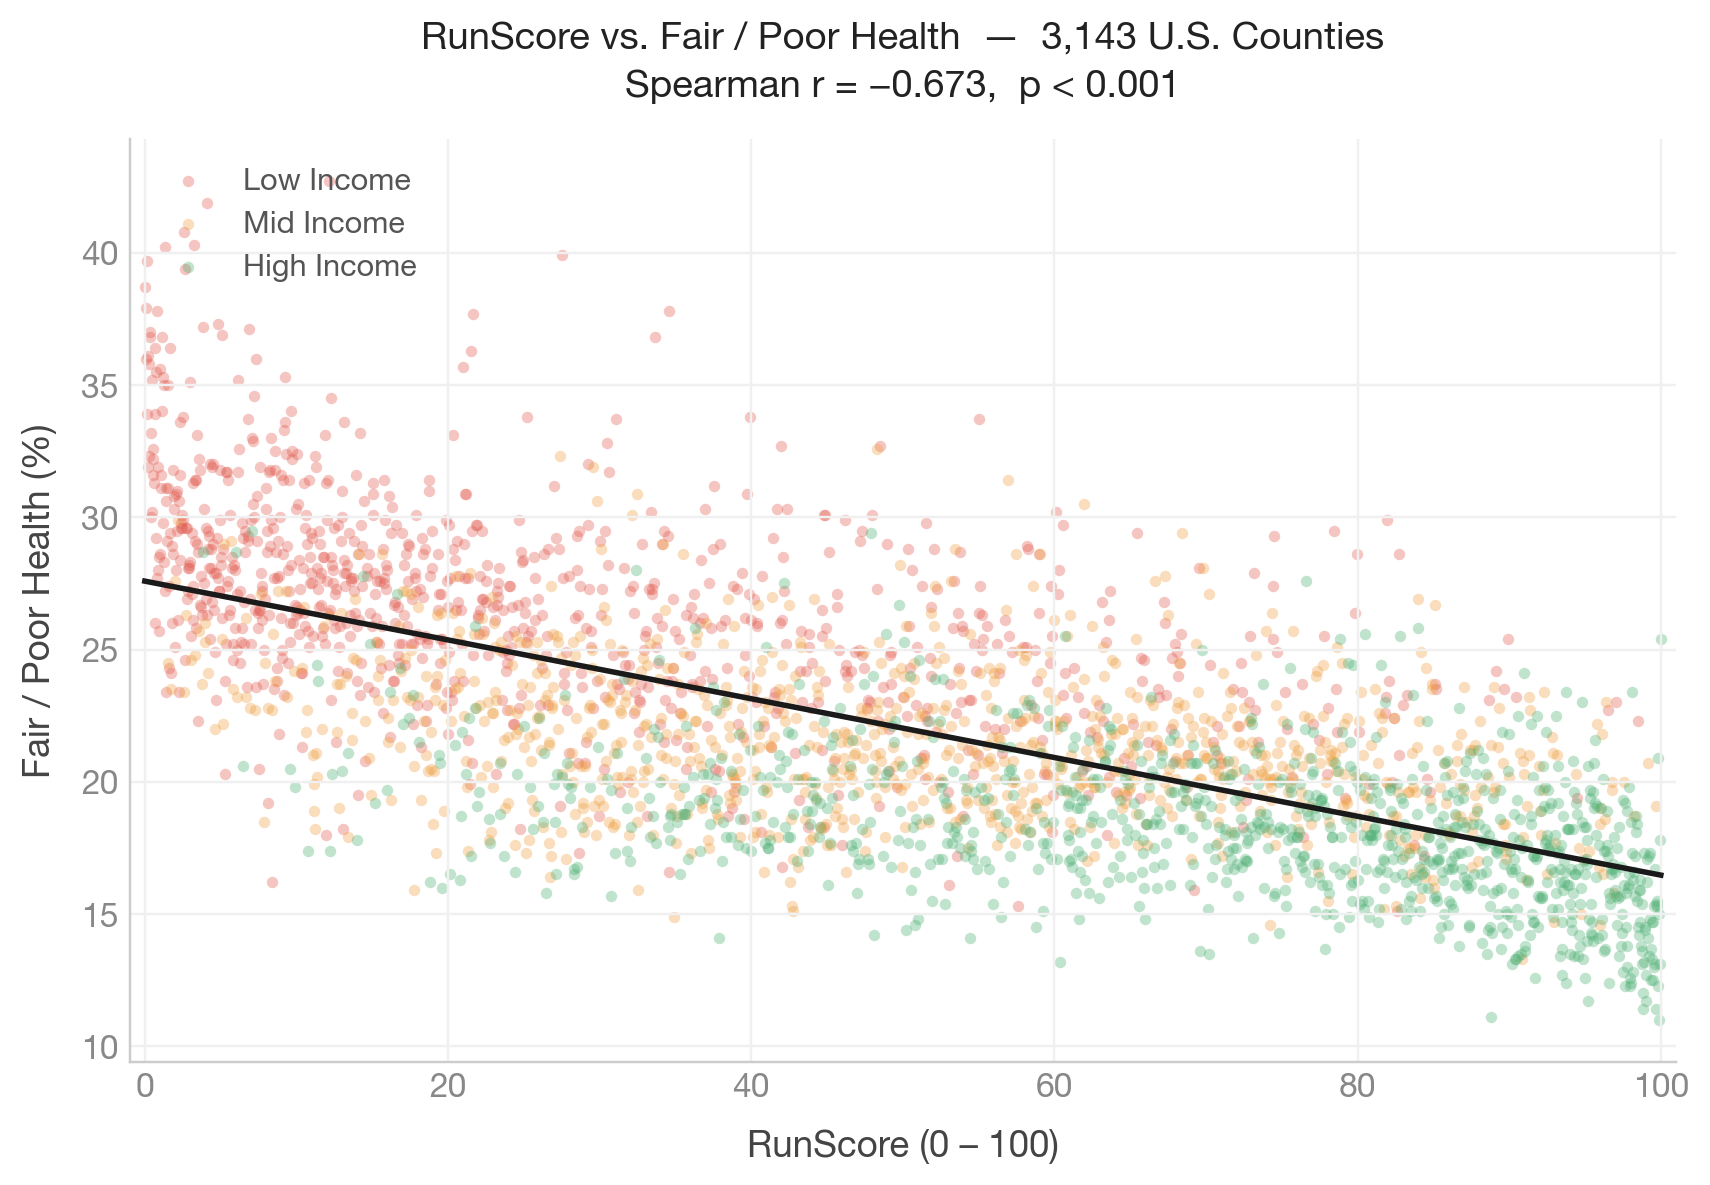
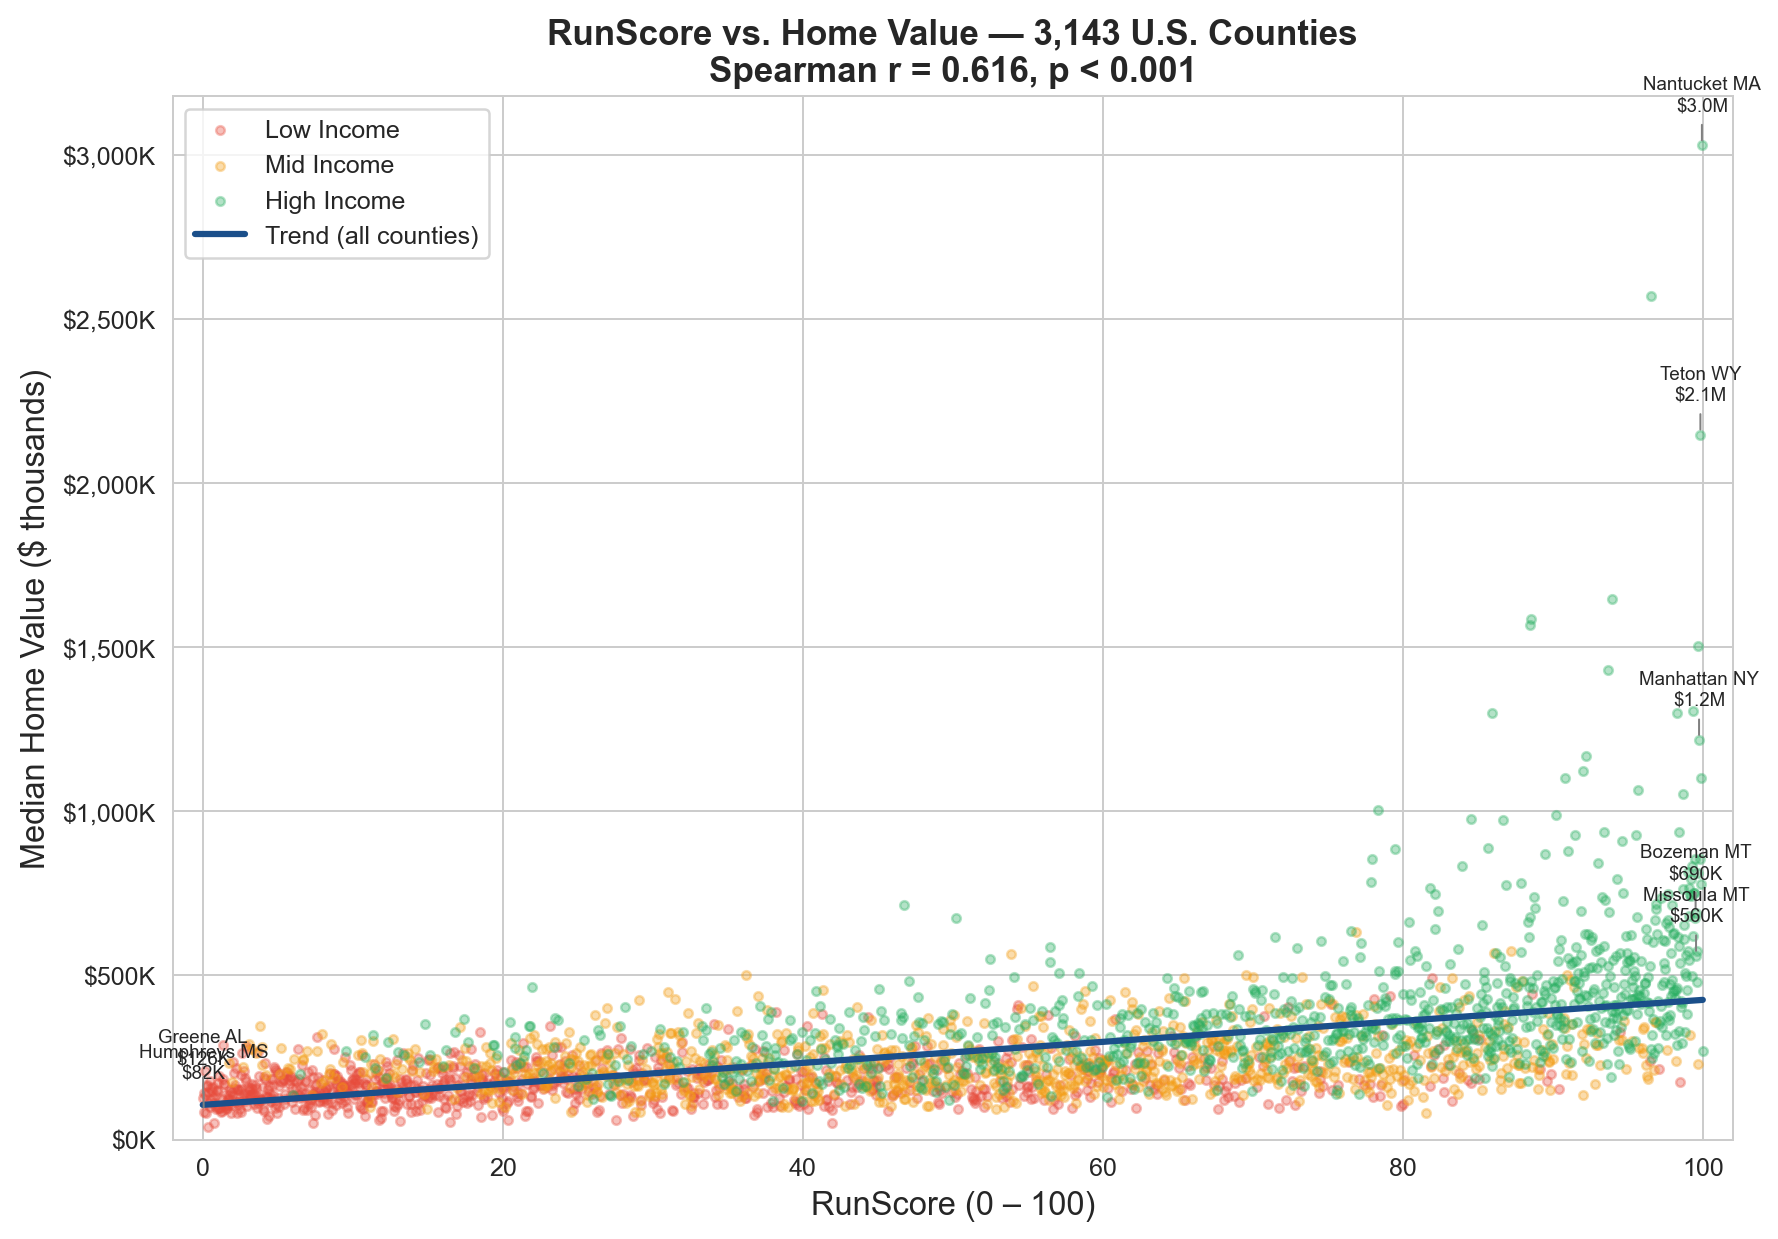
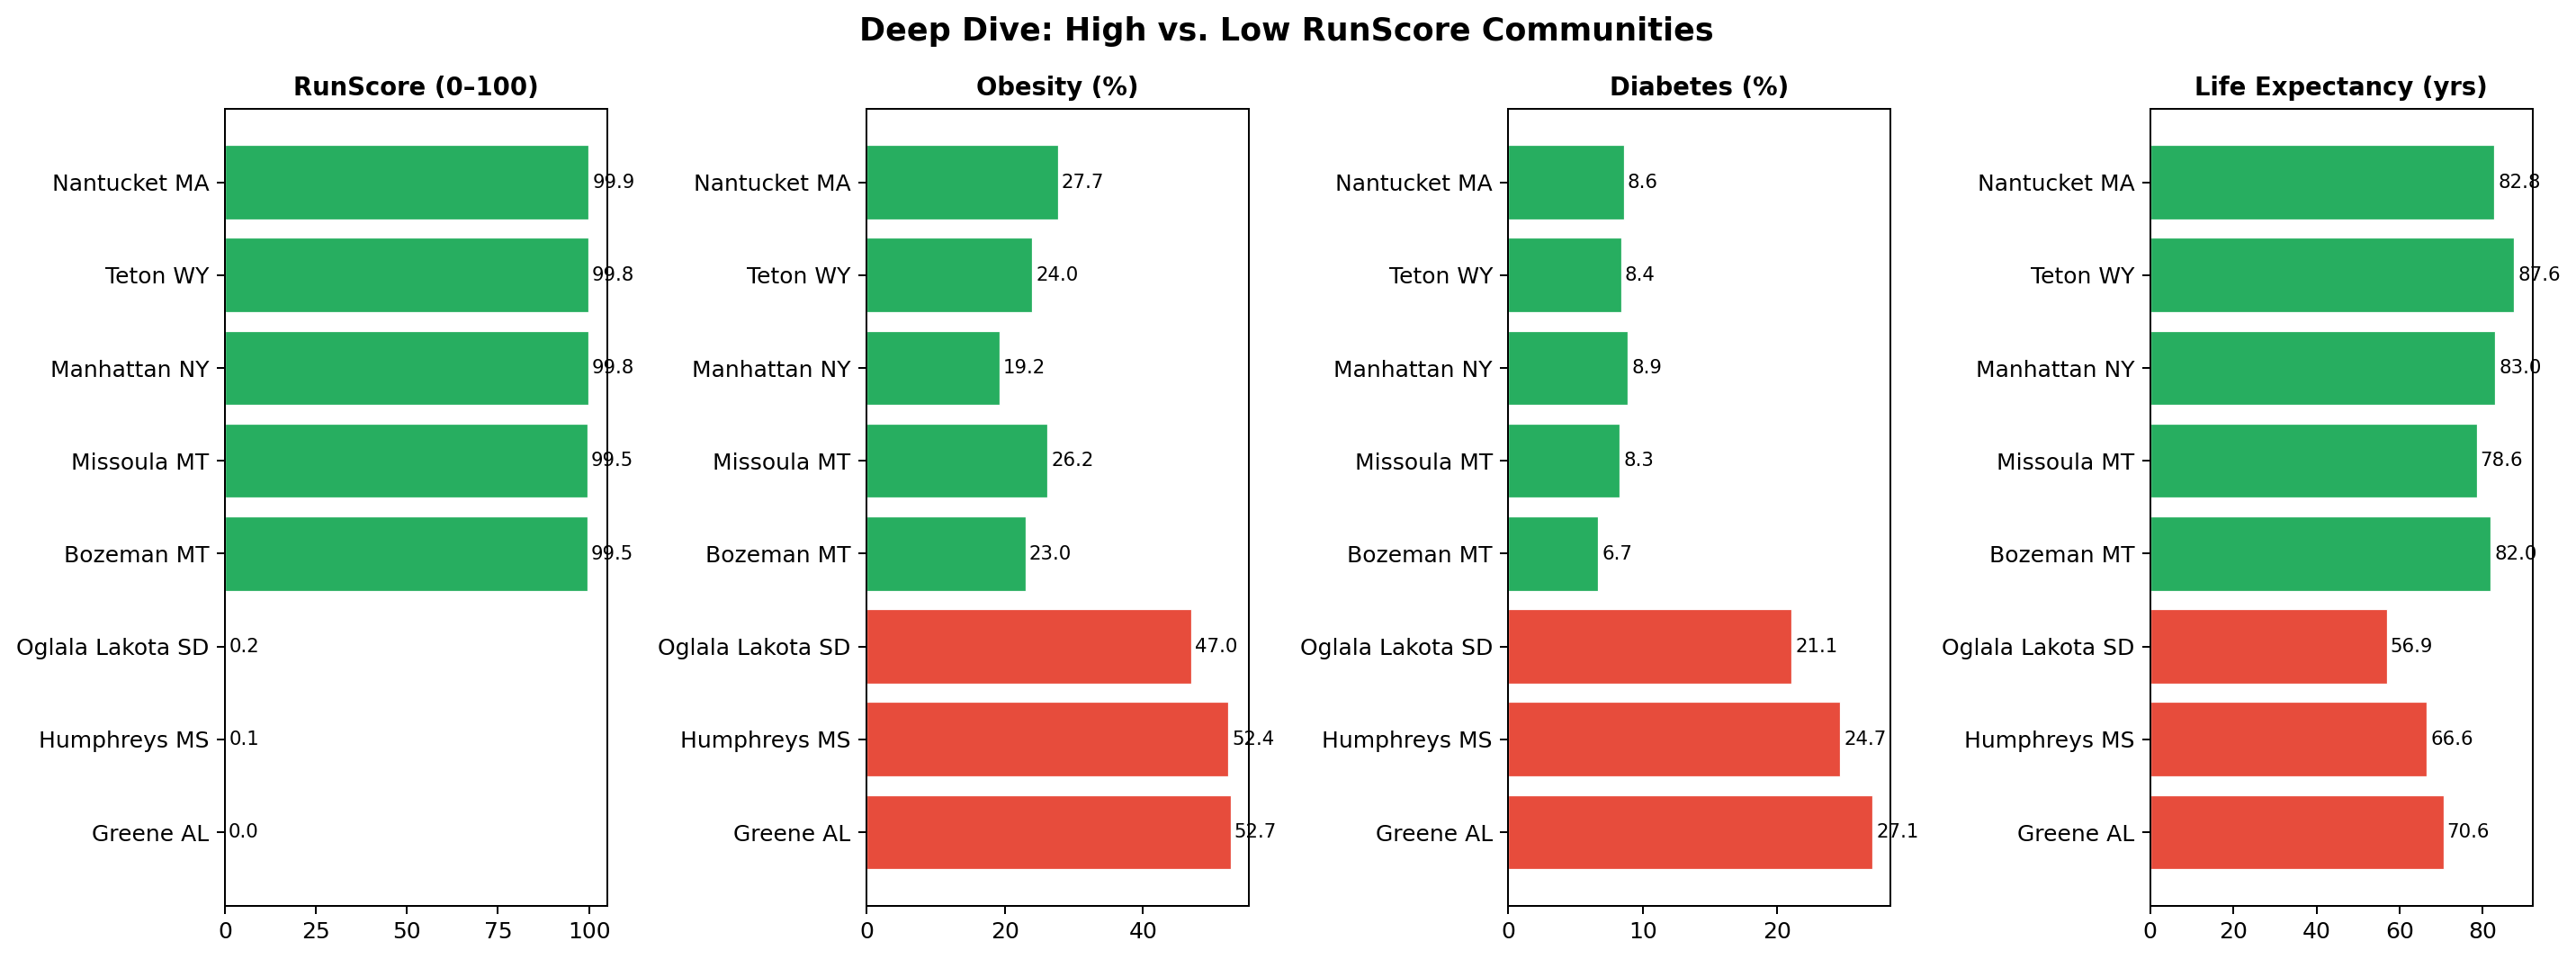
Communities that run live longer, stay healthier, and hold their home values better. A 10-point RunScore advantage predicts $7,885 more in median home value, even after controlling for income.

RunScore National Map
Geography · National Distribution
Running culture has a geography — and it is not random
High-RunScore counties cluster in the Northeast, Mountain West, and Pacific Northwest. Low-RunScore counties concentrate in the rural Deep South and Great Plains.

Physical inactivity in the lowest-RunScore counties often exceeds 45–60%. Zero organized races. Near-zero walkability.

Every county gets a score from 0 to 100. A score of 50 is exactly average. The map makes the pattern impossible to miss — running culture isn't spread evenly. It clusters. It has neighbors.
Coverage
FULL NATIONAL
3,143
U.S. counties scored
all 50 states · all urbanicity levels
Home Values
STRONG LINK
+$7,885
extra home value per 10-point RunScore gain
even after accounting for income
Diabetes
STRONG LINK
−1.5 pts
fewer adults with diabetes per 50-point RunScore gain
the strongest health signal in the study
RunScore vs. Obesity Rate
Obesity Rate
Health  ·  Spearman r = −0.570  ·  p < 0.001
Higher RunScore communities carry less obesity
High-RunScore counties consistently have lower obesity — even at the same income level.

About 42% of American adults are obese, but that number isn't the same everywhere. In a county of 25,000 adults, moving from a low to a high RunScore is associated with roughly 675 fewer people with obesity.

Wealth isn't the whole story. RunScore picks up something money alone doesn't buy: a culture where moving is normal, infrastructure exists, and neighbors set the pace.
RunScore vs. Diabetes Rate
Diabetes Rate
Health  ·  Spearman r = −0.676  ·  p < 0.001
The strongest health signal in the study
The strongest health signal in this study. 1 in 5 adults in the lowest-RunScore counties has diabetes. In Jackson Hole — 1 in 11.

Of all health outcomes studied, diabetes tracks most closely with RunScore — because diabetes is deeply tied to inactivity, and running culture directly measures how active a community actually is.

The gap shows up at every income level. Rich counties with low RunScores still have worse diabetes outcomes than middle-income counties with high RunScores.
RunScore vs. Life Expectancy
Life Expectancy
Health  ·  Spearman r = +0.582  ·  p < 0.001
People live longer in high-RunScore counties
Teton County, WY: 87.6 years. Oglala Lakota, SD: 56.9 years. A 30-year gap — visible in a single number.

Life expectancy is the bottom line — how long do people actually live here? High-RunScore counties consistently come out ahead, even after accounting for income and urbanicity.

This 30-year gap is not caused by running. But it is measured by RunScore — and RunScore is a way to see that dimension of community wellbeing at national scale.
RunScore vs. Fair/Poor Health
Fair / Poor Health
Health  ·  Spearman r = −0.673  ·  p < 0.001
How communities feel about their own health
In low-RunScore counties, nearly 1 in 3 adults rates their health as fair or poor. In high-RunScore communities, below 1 in 10.

Self-reported health is one of the most reliable predictors of how long someone will live — sometimes more accurate than lab results. A community where people feel healthy is a community where they actually are.

Buyers choosing a community are implicitly choosing a health culture. RunScore makes that culture visible and comparable across all 3,143 U.S. counties.
RunScore vs. Home Value
Findings · Real Estate
Homes are worth more in high-RunScore counties — even when income is the same
Every 10-point RunScore increase predicts $7,885 more in home value — even comparing counties at the same income level.

Two counties. Same median income. The one with the higher RunScore has significantly more valuable homes. Go up 50 points — from a car-dependent suburb to a walkable outdoor town — and that gap grows to over $42,000.

The effect is strongest in rural areas — exactly where real estate platforms have the least lifestyle data. In small towns, RunScore does the most work.
5-Year Appreciation Signal
LEADING INDICATOR
+0.9 pts
home value growth over 5 years per 10-point RunScore gain
Strikingly, income barely predicts appreciation — but RunScore does
Rural Advantage
NON-METRO COUNTIES
+0.37%
home value gain per RunScore point in small towns and rural areas
vs. cities — RunScore matters most where other lifestyle data runs out
Community Deep Dive
Community Profiles · Deep Dive
The gap between extremes
Teton County, WY — RunScore 99.8. Life expectancy 87.6 yrs. Home values $2.1M.

Oglala Lakota, SD — RunScore 0.2. Life expectancy 56.9 yrs. Zero organized races.

The 30-year gap in life expectancy between these two counties isn't explained by running alone. But running culture is one measurable dimension of what separates them — and RunScore puts a number on it for all 3,143 U.S. counties.
Rankings · Highest RunScore
Top counties
Nantucket, MA
$3,029,344 · 17.2% inactive
99.9
Teton, WY (Jackson Hole)
$2,147,757 · +67.5% 5yr
99.8
New York, NY (Manhattan)
$1,217,413 · 20.4% inactive
99.8
Gallatin, MT (Bozeman)
$689,955 · +31.8% 5yr
99.5
Missoula, MT
$559,508 · income $72k
99.5
King, WA (Seattle)
13.9% inactive · 6.5 races/100k
99.5
Rankings · Lowest RunScore
Bottom counties
Greene, AL
44.7% inactive · 0 races
0.0
Humphreys, MS
47.9% inactive · $82,469
0.1
Oglala Lakota, SD
Life exp: 56.9 yrs · 0 races
0.2
Kenedy, TX
59.8% inactive · 0 races
0.3
Wilkinson, MS
58.2% inactive · 0 races
0.4
Tensas, LA
56.9% inactive · 0 races
0.5
Index
Construction
Five components, one index.
All from publicly available,
annually updated sources.

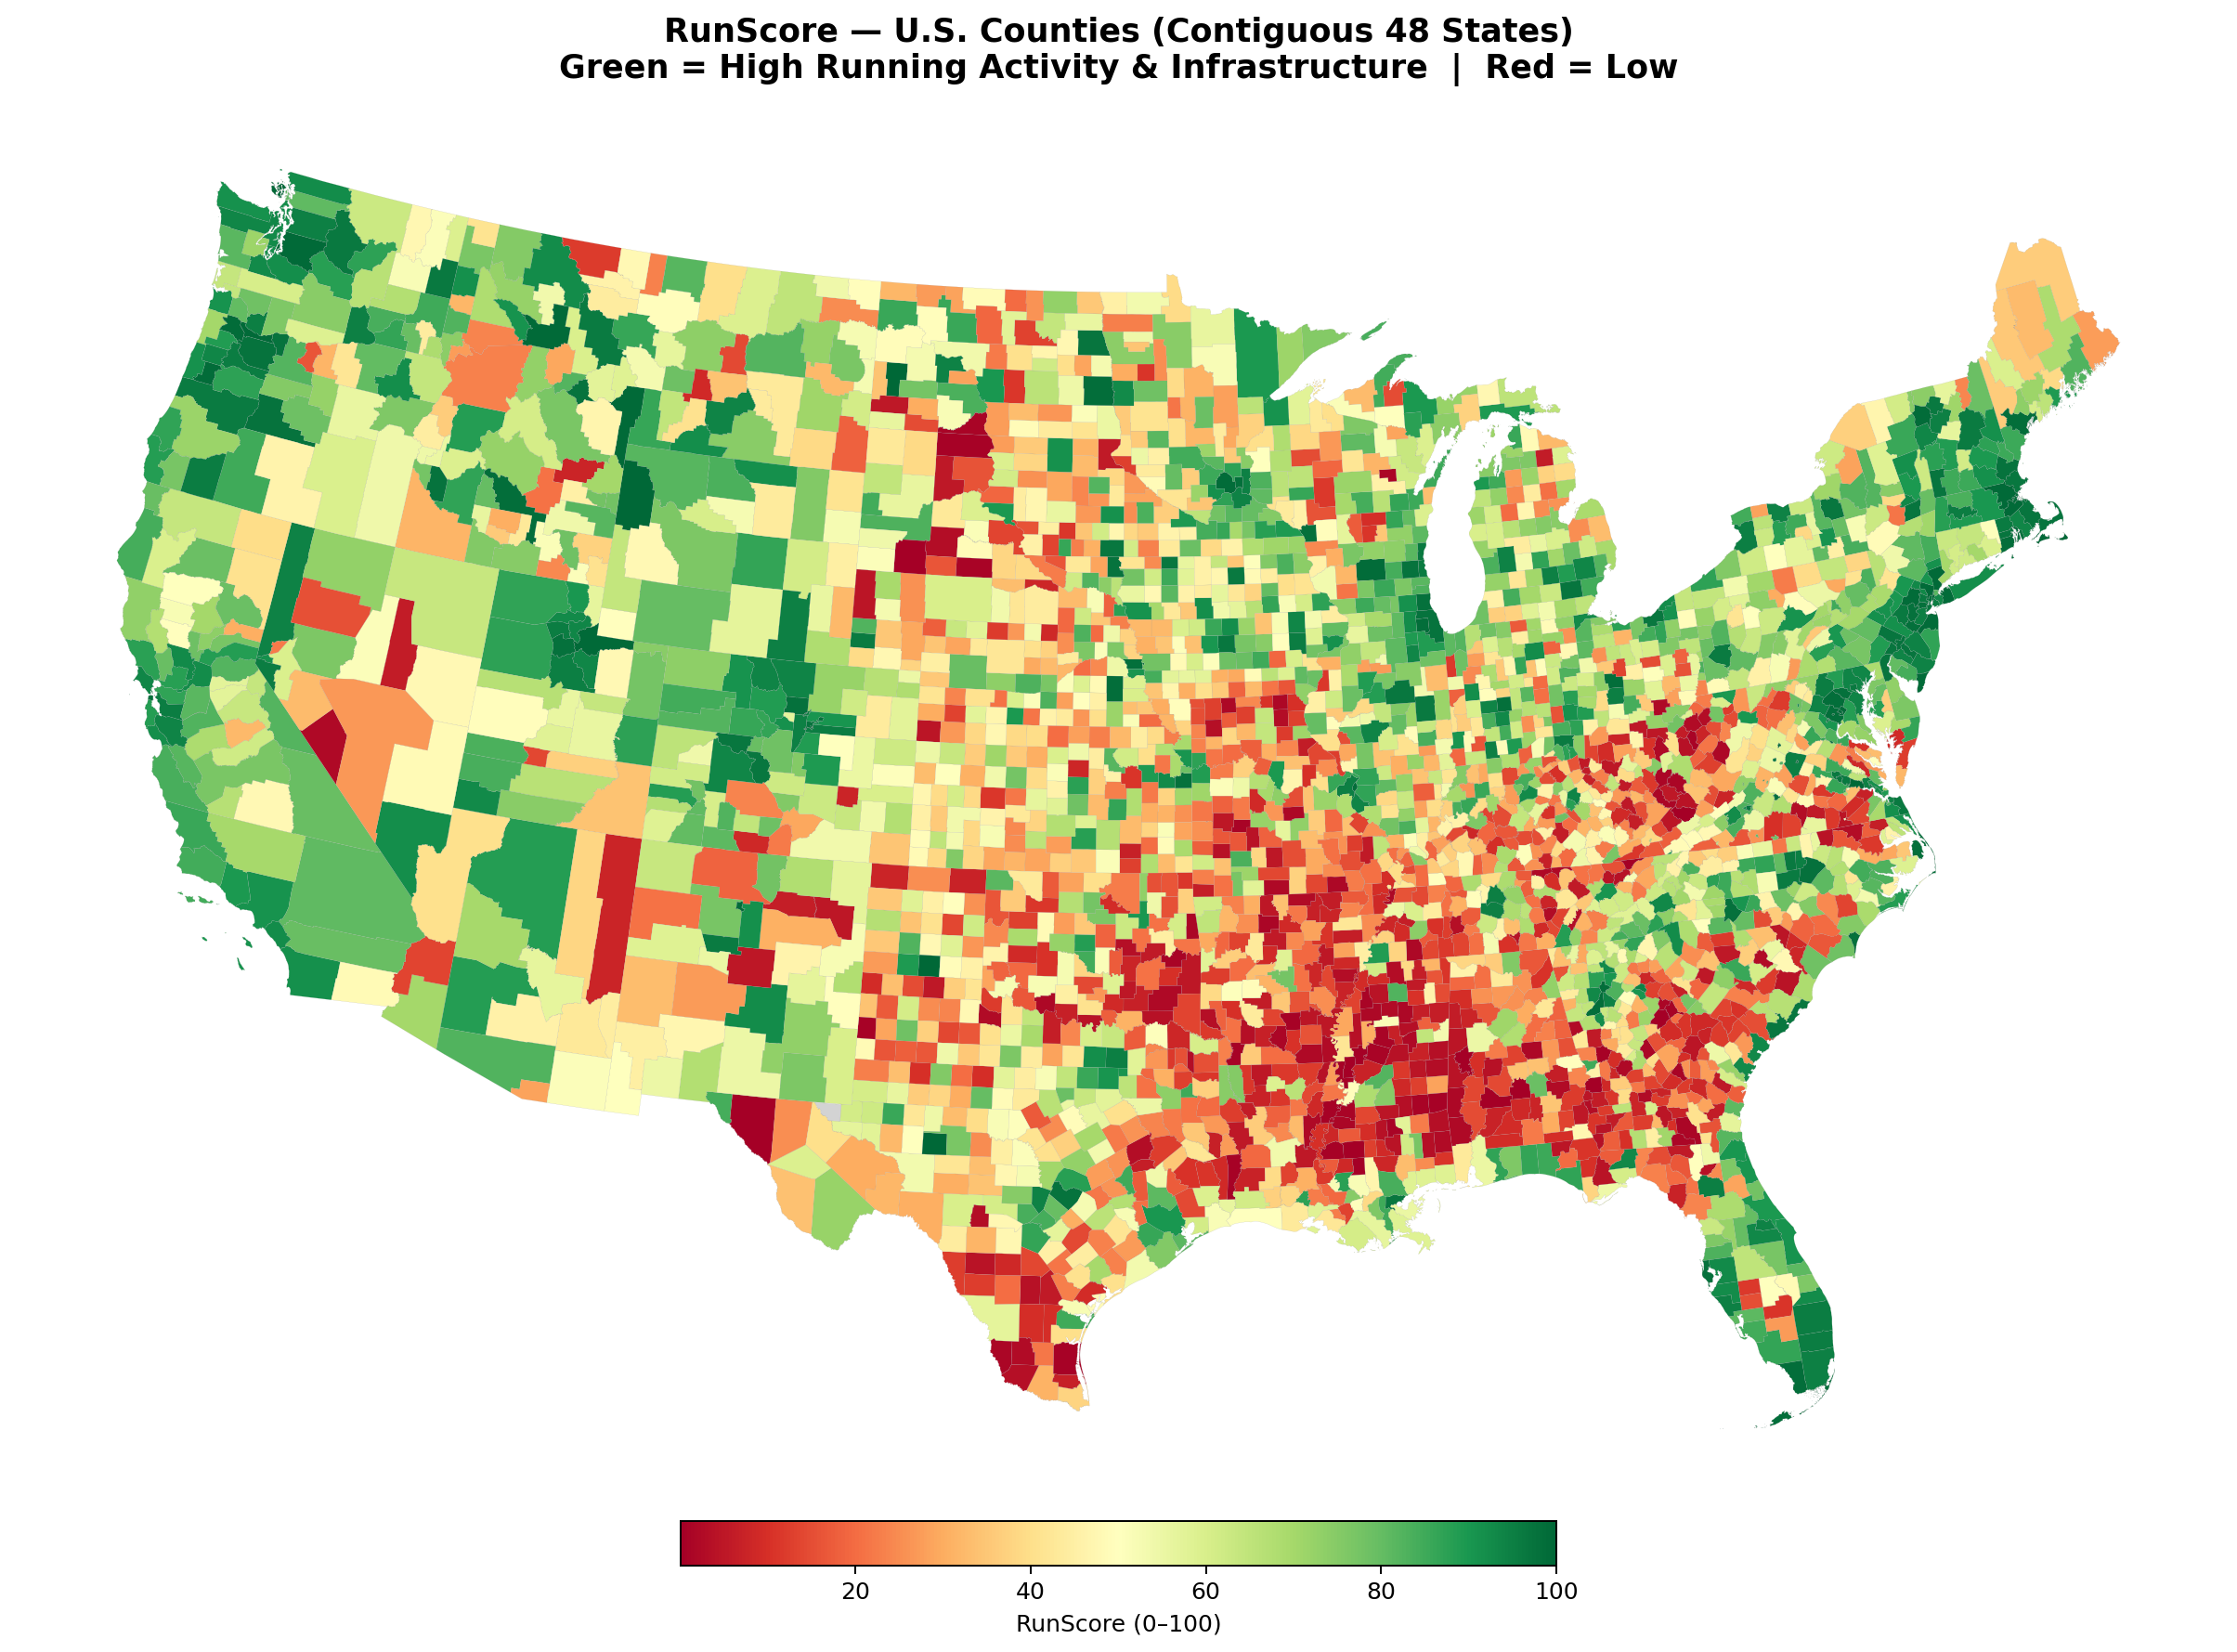
Five data sources. Each one measures a different piece of what it means for a community to have a running culture. We combine them into a single score — 0 to 100 — so every county in America is comparable on one scale.

  • Physical Activity Level
    What share of adults in a county never exercise in their free time? We flip the number so a higher score means a more active community.
    CDC PLACES 2023
  • Race Event Density
    How many organized road races, trail runs, and marathons happen in a county relative to its population? People who sign up and show up are the clearest signal of a real running community.
    RunSignUp API
    17,810 events
  • Exercise Infrastructure Access
    What share of residents actually have a gym, park, or facility nearby to exercise? Access matters — you can't build a habit around something that isn't there.
    County Health Rankings 2025
  • Fitness Facility Density
    How many gyms and fitness centers exist per person in the county? More facilities means more options, lower barriers, and a stronger culture of physical activity.
    USDA Food Environment Atlas
  • Neighborhood Walkability
    Are the streets safe and connected enough to walk and run outside? The EPA scores every neighborhood in the country — we roll those up to the county level.
    EPA National Walkability Index 2021
Applications · Real Estate Platforms
Built for Zillow-scale integration
RunScore sits alongside Walk Score and school ratings — capturing the one dimension they don't: whether a community has actually built the conditions for an active lifestyle.

All five components come from publicly available, annually updated datasets. No proprietary data, no licensing fees. A platform could publish RunScore for all 3,143 counties and update it every year as CDC, EPA, and RunSignUp data refresh.
LISTING BADGE SEARCH FILTER RELOCATION MATCHING APPRECIATION SIGNAL ANNUAL UPDATE NO PROPRIETARY DATA